
The European Career Outlook Index: Methodology Deep Dive
The full methodology, scoring rubric, and limitations of Orvo's European Career Outlook Index — the framework behind the headline rankings and the analysis in the main report.
This piece is the methodological companion to The European Career Outlook Report 2026. It exists for readers who want to interrogate, replicate, or build on the index — researchers, journalists, talent strategists, HR analysts, and serious professionals who would rather see the working layer than the headline number.
Why most career advice fails — and what ECOI fixes
Most career advice operates at one of two altitudes. Either it is purely macro — the world is changing, AI is coming, learn new skills — and gives the individual no actionable purchase on their specific situation. Or it is purely tactical — here are five tips for your next performance review — and gives the individual no view of the structural forces that determine whether the tactics will matter at all.
Both altitudes leave the most important question unanswered: how exposed is the role I am actually in, today, to the structural forces reshaping my industry? Without that answer, individual planning has no calibration. With it, planning becomes possible.
The European Career Outlook Index (ECOI) was built to answer that question. It is a directional scoring framework for assessing the resilience of a corporate role in the European labour market in 2026. It is not a forecast and it does not predict whether any individual will keep their job. It estimates the exposure of the role class itself to the four converging forces documented in the main report, weighted by the individual-level levers that mitigate them.
This piece documents the full methodology — the six variables, the weights, the scoring rubric, the data sources, and the limitations. It is written transparently because the framework can only be cited if it can be interrogated, and it can only be interrogated if its construction is documented.
The six variables
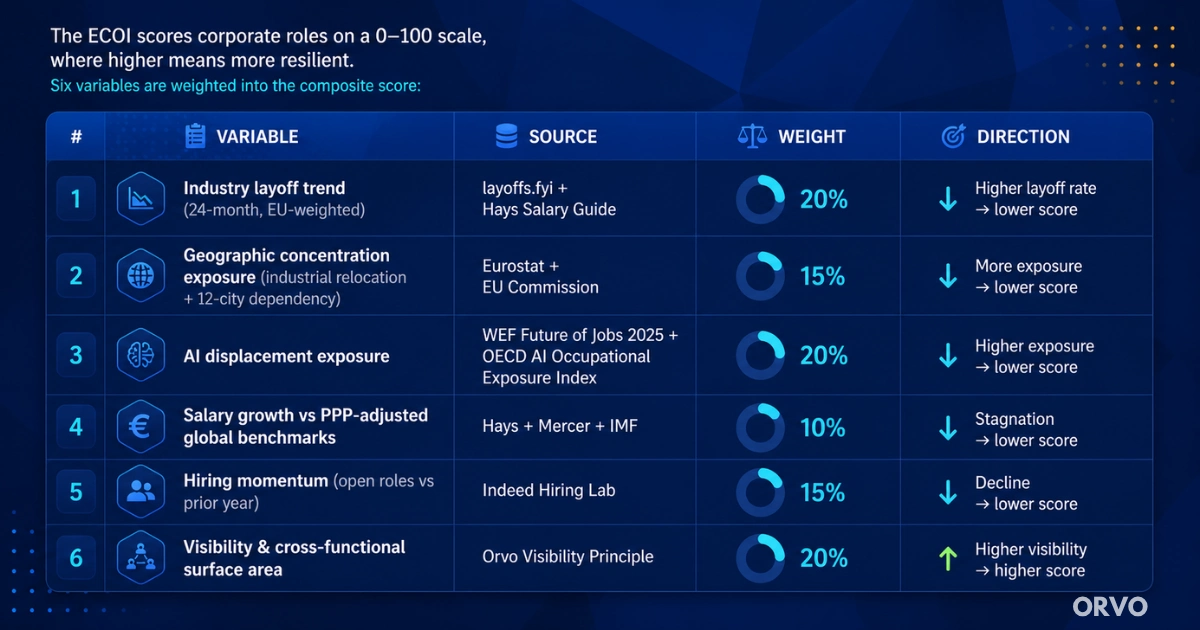
The ECOI scores corporate roles on a 0–100 scale, where higher means more resilient. Six variables are weighted into the composite score:
| # | Variable | Source | Weight | Direction |
|---|---|---|---|---|
| 1 | Industry layoff trend (24-month, EU-weighted) | layoffs.fyi + Hays Salary Guide | 20% | Higher layoff rate → lower score |
| 2 | Geographic concentration exposure (industrial relocation + 12-city dependency) | Eurostat + EU Commission | 15% | More exposure → lower score |
| 3 | AI displacement exposure | WEF Future of Jobs 2025 + OECD AI Occupational Exposure Index | 20% | Higher exposure → lower score |
| 4 | Salary growth vs PPP-adjusted global benchmarks | Hays + Mercer + IMF | 10% | Stagnation → lower score |
| 5 | Hiring momentum (open roles vs prior year) | Indeed Hiring Lab | 15% | Decline → lower score |
| 6 | Visibility & cross-functional surface area | Orvo Visibility Principle | 20% | Higher visibility → higher score |
Each variable is independently scored 0–100 against benchmark distributions. The composite ECOI score is the weighted sum of the six. The lowest-scoring observed roles in 2026 fall into the high teens; the highest-scoring fall into the mid-eighties.
What follows is the substantive logic behind each variable — what it captures, where the data comes from, and why it is weighted as it is.
Variable 1: Industry layoff trend (20%)
This variable captures the rolling 24-month layoff intensity in the role's industry, weighted toward European data where available. We use layoffs.fyi as the primary data source for tech-sector observations, supplemented with Hays Salary Guide regional reports for non-tech industries and Eurostat regional employment data as a triangulating reference.
Layoffs are weighted by recency: the last 12 months count for two-thirds of the score, the prior 12 months for one-third. This avoids over-penalising industries that recovered after a 2023 reset and over-rewarding industries that have only recently entered structural decline.
The variable is weighted at 20% because layoff trend is the most concrete leading indicator of role-class health. Industries that have shed material headcount over 24 months are unlikely to add it back fully, and the residual headcount is structurally more exposed to subsequent rounds.
Variable 2: Geographic concentration exposure (15%)
This variable captures two related forms of geographic vulnerability: exposure to industrial relocation (energy-intensive manufacturing leaving Western Europe for Asia) and exposure to the 12-city problem (concentration of global-grade roles in approximately twelve European cities, with limited substitutes outside).
For industrial relocation, we use Eurostat sectoral employment trend data combined with EU Commission Energy Bulletin data on energy-intensive sectors. Industries with declining EU-27 employment in energy-intensive sub-sectors score lower (more exposed); industries with stable or growing EU-27 employment score higher.
For the 12-city dependency, we score roles by whether they exist meaningfully outside the twelve hub cities. Roles concentrated entirely within the hubs are scored as more geographically exposed; roles with viable distribution across smaller cities and regions score higher.
The variable is weighted at 15% — substantial but lower than the layoff and AI variables because geographic concentration affects recovery from a layoff more than it affects the probability of a layoff happening.
Variable 3: AI displacement exposure (20%)
This variable captures the role class's exposure to current and near-term AI capability. We use the WEF Future of Jobs Report 2025 task-level decomposition combined with the OECD AI Occupational Exposure Index as primary sources.
Roles whose task composition is heavily weighted toward processes that current AI tools can perform competently — text generation, document review, standard analysis, basic translation, structured data manipulation — score lower (more exposed). Roles whose task composition is weighted toward tasks AI cannot yet perform reliably — judgement under ambiguity, complex relationship management, novel problem framing, regulatory navigation — score higher.
The variable is weighted at 20% because AI displacement is the fastest-moving structural pressure in the European white-collar labour market, with capability boundaries shifting on a quarterly cadence. We update the underlying scoring as the WEF and OECD update their reference frameworks; the weight itself is stable.
Variable 4: Salary growth vs PPP-adjusted global benchmarks (10%)
This variable captures whether the role's compensation is growing, holding, or declining relative to PPP-adjusted global benchmarks for equivalent roles. Primary sources: Hays Salary Guide regional reports, Mercer Total Remuneration Survey, supplemented with IMF and Eurostat purchasing-power-parity adjustments to allow cross-country comparison.
The variable is weighted at 10% — the lowest weight in the composite — because European salary stagnation is broadly universal across white-collar roles and therefore differentiates them poorly. Adding more weight to this variable would compress the composite scores toward the middle without adding much signal. The variable is included because it captures cases where salary growth is abnormally poor (e.g. mid-tier auto industry technical roles, where stagnation has accelerated post-2022) or abnormally strong (e.g. AI/ML product management at US-headquartered firms in Europe).
Variable 5: Hiring momentum (15%)
This variable captures the trend in open roles for the role class versus the prior year. Primary source: Indeed Hiring Lab, supplemented with selective LinkedIn Economic Graph public data where available.
Hiring momentum is the cleanest leading indicator of role-class health that we have access to. Industries and roles with collapsing hiring markets are typically also the ones running headcount-reduction programmes; roles with strong hiring momentum are typically expanding even if individual employers are restructuring. The variable correlates strongly with the layoff trend variable but adds independent signal in cases of asymmetric markets (where layoffs and hires are happening simultaneously across different employers within the same industry).
The variable is weighted at 15% — meaningful but lower than layoff trend itself, because hiring momentum is more sensitive to short-term macro conditions and therefore noisier as a structural signal.
Variable 6: Visibility & cross-functional surface area (20%)
This is the variable that distinguishes the ECOI from a pure exposure index, and it is the original analytical layer of Orvo's framework.
The first five variables score the macro environment of a role. The sixth variable scores the individual-level structural property of the role class — specifically, how visible the work is to people who matter, and how cross-functional the role's surface area is. Two roles in the same industry, with the same AI exposure and the same hiring momentum, can have materially different career resilience depending on whether their execution is visible across multiple functions or buried inside a single team.
A role scores higher on visibility when:
- Its output is consumed across multiple functions, not just by the home team
- It interfaces routinely with senior stakeholders two or more levels above
- Its impact is measurable and attributable to a named individual rather than buried in an aggregate team metric
- It carries natural cross-functional surface area — project work, customer interface, regulatory or compliance work, executive support
- The person filling it has known relationships with people who would notice if they left
A role scores lower when:
- Output is consumed by a single internal team
- Senior-stakeholder exposure is limited
- Impact is buried in aggregate team performance
- The work is purely individual-contributor mode with no cross-functional rituals
- Relationships are concentrated in a small number of immediate colleagues
The full theoretical treatment of this variable lives in Why High Performers Still Get Laid Off (And Who Actually Survives), which documents the underlying Visibility Principle and the legibility trap that mechanises it.
The variable is weighted at 20% — equal with the strongest macro variables — for one reason. The argument of the wider report is that individual positioning matters as much as industry-level forces in a stagnating environment. If we weighted visibility at 5%, we would be implicitly saying the macro determines everything; if we weighted it at 50%, we would be saying the macro doesn't matter. Twenty per cent is the honest balance between those two errors, and it is the weight at which the composite score most closely tracks observed reorganisation outcomes when applied retrospectively to publicly-documented European corporate restructurings.
Why we did not include certain variables
Several plausible variables were considered and excluded.
Tenure / age cohort effects were excluded because they correlate strongly with several other variables already in the composite, and adding them risks double-counting. A senior PM in pharma is, on average, older and longer-tenured than a junior translator — but that difference is already captured by the visibility and AI displacement variables, not by tenure as a separate input.
Education level / credential prestige was excluded for similar reasons. The credential differences between role classes are largely already captured by the other variables; adding a credential variable risks turning the index into an indirect ranking of universities rather than a ranking of role resilience.
Compensation absolute level was considered and rejected. High-paid roles are not necessarily high-resilience roles, and low-paid roles are not necessarily low-resilience. Including absolute compensation in the index would have introduced a positive correlation between pay and score that does not consistently hold in the data — mid-tier banking is well-paid and high-exposure; clinical project management in pharma is moderately paid and high-resilience.
Demographic variables were excluded both because they introduce ethical complications and because the ECOI is intentionally a role-class index rather than an individual-level prediction. Demographic factors that affect individual outcomes within a role class are real, important, and outside the scope of this index.
Country-level macroeconomic indicators (GDP growth, unemployment) were considered and partially absorbed into Variable 2 (geographic exposure). The full country-level macro is documented separately in the main report; the index uses the structural geographic component of it.
Score bands and what they mean
Composite ECOI scores fall into five bands:
- 80–100 — Highly resilient. Cross-functional senior product managers in regulated industries, healthcare clinical leadership, defence and security technical roles, EU compliance specialists, regulatory affairs heads. The combined macro environment is favourable and the visibility surface is structurally high. These roles are not immune to reorganisation, but the structural pressure on them is mild and the individual lever (visibility) is operating in their favour.
- 60–79 — Resilient. Cross-functional individual contributors in stable sectors, mid-management roles with stakeholder breadth, customer-facing senior roles in growth industries. The macro is mixed-to-favourable; the visibility lever can be deliberately strengthened.
- 40–59 — Exposed but recoverable. Most generalist white-collar roles in mature industries — middle-tier finance, mid-level marketing, generalist HR business partners. These roles are absorbing real structural pressure but are not in acute decline; the individual lever is the difference between holding position and slipping into the next band down.
- 20–39 — Highly exposed. Manufacturing technical roles in Germany and Italy, mid-tier banking roles in London, marketing roles dependent on advertising-funded business models, sales roles in industries facing structural decline. Multiple macro variables are negative; the visibility lever can mitigate but not fully offset.
- 0–19 — Acute risk. Energy-intensive manufacturing operatives, low-visibility individual contributors in declining sectors, process-heavy back-office roles with no cross-functional interface. All macro variables negative; visibility variable typically also low. These role classes are the ones most likely to compress materially or disappear over the next five years.
The boundaries between bands are slightly arbitrary by construction — they are designed to produce a usable categorisation rather than to reflect natural breakpoints in the data. The granular numerical score is more informative than the band label for any specific application.
Honest limitations
The ECOI is a directional framework, not a forecast. It has four important limitations that researchers and journalists citing it should be aware of.
1. It scores role classes, not individuals. Two professionals in the same role class can have very different outcomes depending on their visibility, their AI fluency, their relationship capital, and their timing. The ECOI is the macro starting point for individual planning, not a substitute for it.
2. The visibility variable is necessarily judgemental. Variables 1–5 are quantitatively grounded in public data sources. Variable 6 (visibility) is scored against a structural rubric documented above, but the rubric requires interpretive judgement about how a given role-class typically operates within organisations. We have applied the rubric consistently across the 25 role classes in our published analysis; we acknowledge that other reasonable applications could produce slightly different scores. The methodology is transparent specifically so that other researchers can interrogate, replicate, or modify our scoring.
3. The index is calibrated to 2026 conditions. The macro environment shifts. AI capability frontiers move. Industry layoff cycles turn. The ECOI methodology is designed to be re-run annually with updated data, but the absolute scores in any given year are only valid for that year. Citing 2026 ECOI scores in 2028 without updating the underlying data is an error.
4. The framework is intentionally European. The four converging forces it captures (industrial relocation, AI capacity gap, the productivity/employer-cost trap, and geographic concentration) are specific to the European structural picture. The same six variables applied to the US or Asian labour markets would produce a different distribution of scores; the framework would need to be adapted for those contexts. We do not currently publish equivalent indexes for other regions.
How to cite the ECOI
Citation format:
Ciornei, S. (2026). The European Career Outlook Index. Orvo. https://getorvo.com/learn/european-career-outlook-2026
The methodology is published under Creative Commons Attribution 4.0 International. Researchers and journalists are welcome to apply, modify, or critique the framework with attribution. We encourage replication: the index is more valuable as a starting point for further analysis than as a closed proprietary system.
For the full applied analysis, see The European Career Outlook Report 2026. For the headline rankings, see The Most Resilient Careers in Europe in 2026. For the underlying Visibility Principle, see Why High Performers Still Get Laid Off (And Who Actually Survives).
Sources
Primary data sources
- layoffs.fyi (industry layoff data, 2024–2026 rolling)
- Hays Salary Guide 2025/2026 (regional)
- Indeed Hiring Lab (open roles, hiring momentum, EU-specific)
- WEF Future of Jobs Report 2025 (task-level AI decomposition)
- OECD AI Occupational Exposure Index
- Eurostat (sectoral employment, regional GDP, productivity series)
- EU Commission Energy Bulletin (energy-intensive sector data)
- IMF World Economic Outlook DataMapper (PPP adjustments, country GDP per capita)
- World Bank (country GDP per capita series, 1990–2024)
- Mercer Total Remuneration Survey (compensation benchmarks)
Theoretical framework
- The Visibility Principle and legibility trap — original Orvo framework, documented in Why High Performers Still Get Laid Off
- The four converging forces — documented in The European Career Outlook Report 2026
Adjacent academic work
- Bruegel — The European Union's remarkable growth performance relative to the United States (Darvas, 2023)
- Banque de France — Revisiting the European performance gap vis-à-vis the United States (2025)
- European Central Bank — Labour productivity growth in the euro area and the United States (Economic Bulletin, June 2024)
- Mario Draghi — The future of European competitiveness (2024)
- Center for Security and Emerging Technology, Georgetown — China is Fast Outpacing US STEM PhD Growth
- Stanford HAI — 2025 AI Index Report
This methodology is part of The European Career Outlook Report 2026 by Orvo. To receive the full PDF — pillar plus all five companion analyses — join our newsletter.
Republication permitted with attribution to Orvo and a link back to this article (Creative Commons Attribution 4.0).