
Why European Salaries Have Stagnated Since 2008
And What That Means for Your Career
The data behind two decades of European wage stagnation, the productivity gap that drives it, and the individual career strategy that follows from understanding both.
This piece is part of The European Career Outlook Report 2026, Orvo's flagship analysis of the four structural forces reshaping European white-collar work — and the two compounding levers (visibility and AI fluency) that determine which professionals thrive.
Quick summary
For readers who want the headline numbers up front:
- UK GDP per capita is approximately £11,000 lower per person than it would have been had pre-2008 growth trends continued. Not a forecast — a foregone pay rise. (IEA, working from ONS data)
- The UK ranks 51st on income per person when compared against all 50 US states + UK. Most Britons think the UK ranks 7th. (Institute of Economic Affairs, January 2026)
- EU labour productivity per hour worked is now approximately 82% of the US level, with the gap widening since 2022 and concentrated in digital sectors. (Bruegel, ECB, Banque de France)
- The European Union's share of global GDP fell from 25.3% in 1990 to 16.2% in 2024, forecast to fall to 12.9% by 2030. (World Bank; IMF)
- In France, a €60,000 gross salary results in €39,500 net to the worker but a total cost of €95,300 to the employer — a 139% loading. Similar structures exist across Belgium, Italy, Sweden, and Germany.
What follows is the data, the structural causes, and what the individual European professional should do about it.
The basic shape of the stagnation
European wages did not collapse after 2008. They simply stopped tracking growth. The continent did not get poorer in absolute terms — the EU economy grew by roughly 72% between 1990 and 2024 in current prices — but it grew far slower than its trading partners. The world economy expanded by more than 380% in the same period. The result is the largest generational transfer of relative wealth in modern economic history, away from Europe and toward Asia.
For working professionals, the shift shows up in three places: the gap between what their wages would have been on the pre-2008 trajectory and what they actually are; the gap between their compensation and what equivalent professionals earn in the US or in elite Asian frontier firms; and the gap between what their employers pay for them and what they take home. Each of these gaps has its own structural cause. Together they describe a continent in slow wage decline measured against everywhere it actually competes for talent.
The £11,000 gap
The Institute of Economic Affairs, working from Office for National Statistics data, has documented that UK GDP per capita today is approximately £11,000 per person lower than it would have been if pre-2008 growth trends had continued. This is not a forecast. It is a foregone pay rise — measured against what was already in motion before the financial crisis. Translated into individual career terms: the average UK worker's compensation today is £11,000 per year lower than the trajectory implied as of 2007. Across an entire working life, that gap compounds to several hundred thousand pounds in foregone lifetime earnings.
The same broad pattern, in slightly different magnitudes, applies across most of Western Europe. Italy, France, and Spain have all experienced extended periods of wage stagnation since the financial crisis. Germany held up better through the 2010s on the back of strong manufacturing exports, but the post-2022 industrial relocation pressure is now eroding even that position.
The 51st ranking
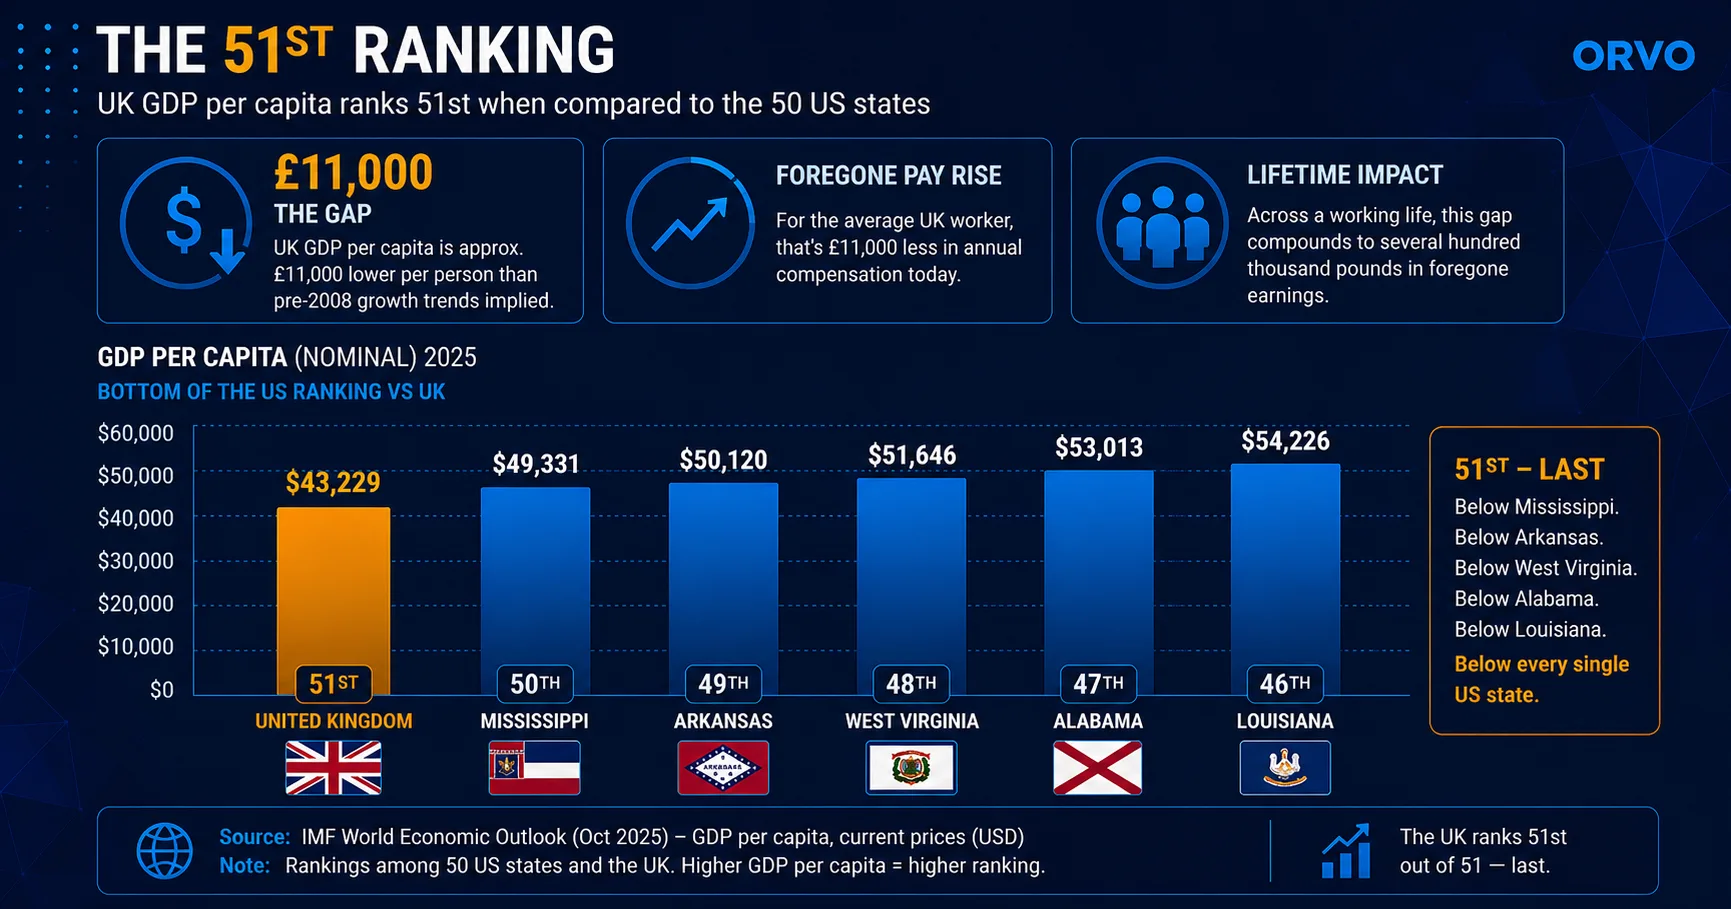
In January 2026, the Institute of Economic Affairs published survey results documenting that most Britons believe the UK ranks roughly 7th on income per person when compared against the 50 US states. The actual ranking, working from IMF data, is 51st — last. Below Mississippi. Below Arkansas. Below every single US state.
This is not a polemical claim. It is what the IMF World Economic Outlook DataMapper produces when you compare UK GDP per capita against state-level US GDP per capita, in nominal terms. The gap between perception and reality is itself part of the problem: a population that believes it is wealthier than it is will consistently mis-price its career options, its employer leverage, and its emigration calculus.
The productivity gap
The deeper structural cause of European wage stagnation is the productivity gap. EU labour productivity per hour worked is now approximately 82% of the US level. Twenty years ago it was approximately 72% and converging upward; the gap narrowed steadily through the early 2000s. Then convergence stopped. After mid-2022, the gap began widening again — the European Central Bank attributes much of the recent divergence to the post-2022 energy shock and to weaker private investment.
The Bank of France, building on the 2024 Draghi Report, has shown that the bulk of the recent productivity divergence is attributable to digital-sector underperformance. In plain language: the gap is now disproportionately an AI and software gap, not a manufacturing one. European workers and European firms have been slower to adopt the digital tools that have driven US productivity growth since 2022, and the resulting output gap shows up directly in wages.
This is, paradoxically, a hopeful framing. The productivity gap is mechanical, not metaphysical. Mechanical gaps can be closed by mechanical interventions. AI fluency at the individual level, deployed at scale within European firms, is the most plausible route to closing it.
The employer cost trap
The story from the worker's side is well-told. The story from the employer's side is the other half, and it has been less discussed. The combined cost of employing a salaried worker in Western Europe is materially higher than the gross salary the worker sees, and much higher than the net salary they take home.
For a €60,000 gross salary across the major Western European economies, the total cost to the employer and the take-home pay for the worker break down approximately as follows:
| Country | Gross salary | Net salary (worker take-home) | Total employer cost | Employer extra (% over net) |
|---|---|---|---|---|
| France | €60,000 | €39,501 | €95,303 | +139% |
| Italy | €60,000 | ~€35,963 | ~€88,326 | +146% |
| Sweden | €60,000 | ~€35,279 | ~€77,618 | +120% |
| Germany | €60,000 | ~€39,679 | ~€74,724 | +88% |
| Spain | €60,000 | ~€39,026 | ~€79,637 | +104% |
| Netherlands | €60,000 | ~€43,678 | ~€77,004 | +76% |
| Switzerland (non-EU reference) | €60,000 | ~€50,117 | ~€68,387 | +36% |
Source: INSEE/Eurostat-derived analysis circulated April 2026.
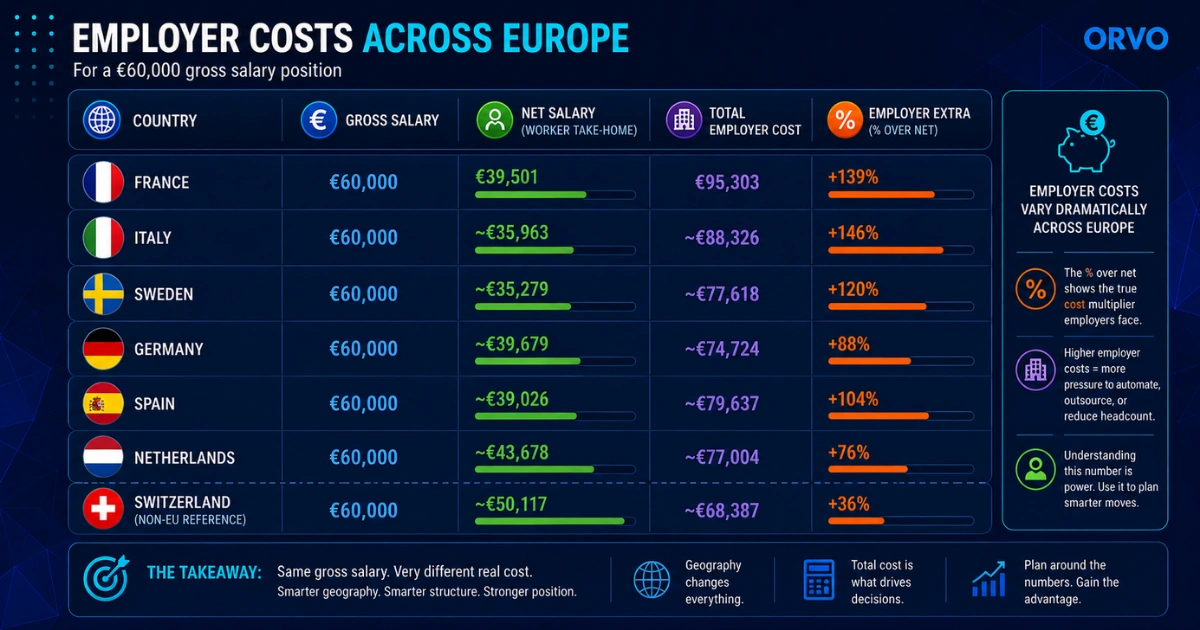
The numbers vary across countries, but the structural pattern is identical. The European worker sees a take-home wage in the high €30,000s for a €60,000 gross. The European employer pays an additional 70–150% on top of net wage in social charges, taxes, and contributions. The worker feels poor. The employer feels expensive.
This is the structural reason both halves of the European labour market are now under pressure. From the worker's side, take-home compensation has not kept pace with the cost of living, particularly housing. From the employer's side, the fully-loaded cost of European labour has become uncompetitive against the alternatives — AI tools that can produce two professionals' worth of output for a fixed €95,000 cost, US-headquartered firms that can hire European workers at lower European salaries while offering US-style equity, and Asian operations where similar work happens at one-third the loaded cost.
Both halves of the equation push toward replacement. Workers upskill out and emigrate. Employers automate, restructure, or relocate.
The China comparison: pay convergence at the top
There is a second comparison that European professionals do not usually make and probably should: not against the US, but against the elite tier of Chinese frontier firms.
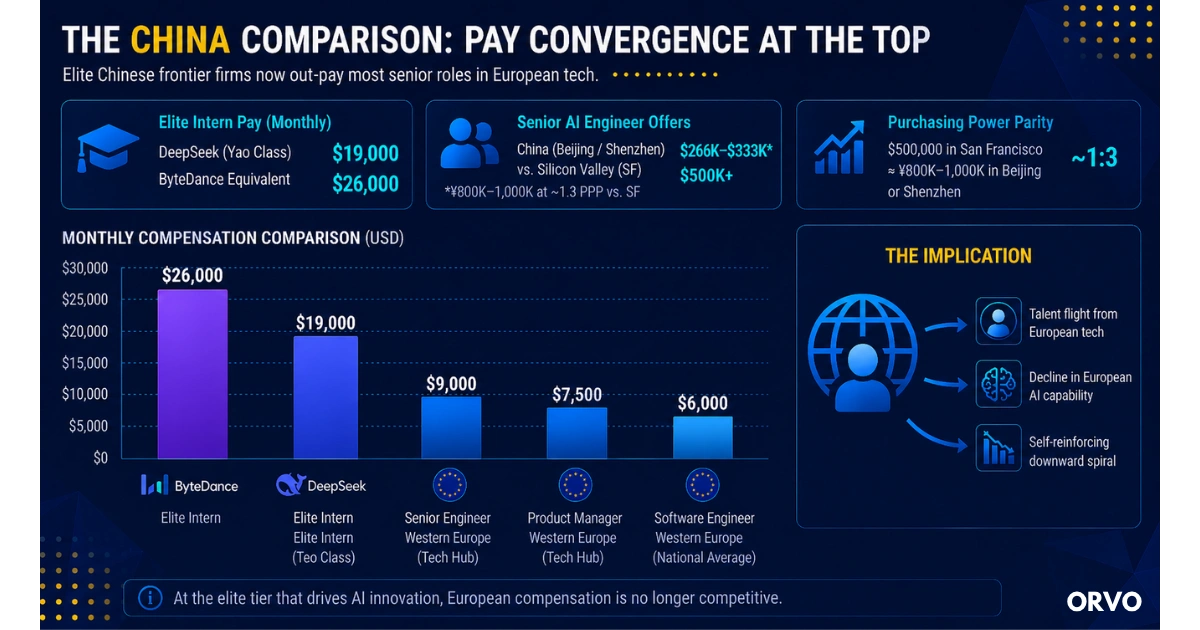
According to widely-reported leaked offers, DeepSeek pays elite Tsinghua "Yao Class" interns approximately ¥5,500 per day, equivalent to roughly $19,000 per month. ByteDance equivalents reach $26,000 per month — for interns. Senior Chinese AI engineers are reportedly choosing offers from Chinese frontier labs over $500,000 packages from Silicon Valley, applying a roughly 1:3 purchasing-power ratio to compare them: $500,000 in San Francisco buys roughly the same lifestyle as ¥800,000–1,000,000 in Beijing or Shenzhen.
The implication for European tech is uncomfortable: in 2026, an elite undergraduate intern at a Chinese frontier lab out-earns most senior European software engineers and product managers. This is not a comparison against typical Chinese white-collar wages — typical Chinese white-collar pay is much lower than European pay. It is a comparison against the talent tier that European companies actually need to attract for their own AI competitiveness. At that tier, European compensation is no longer competitive.
The structural consequence is talent flight from European tech to anywhere with frontier AI work — and the decline of European AI capability that follows from it. This is a self-reinforcing loop the continent has not yet found a way to break.
The Polish counterpoint
The same continent that has produced two decades of stagnation has also produced one of the most successful post-war economic convergence stories.
Twenty years ago, Poland's GDP per capita was 48% of the EU average. Today it is 82%, with forecasts suggesting it will reach 97% of UK levels by 2030. Warsaw's metropolitan area now ranks second in Europe for GDP per capita, behind only Central London. Several Polish regions are now richer than several British regions. Salaries for global-grade corporate roles in Polish hubs are now approaching Western European mid-tier — with a fraction of the cost of living.
The Polish story is the rare positive data point in the European compensation landscape, and it changes which European countries make sense as career destinations going forward. For the globally-mobile professional, the salary arithmetic is direct: a Western European mid-tier salary in Warsaw produces a materially higher real income than the same salary in Frankfurt or Paris. The same is true, in milder form, for Lisbon, Bucharest, Tallinn, and Madrid.
The pattern repeats: the stagnant European story is concentrated in the legacy Western core; the optimistic European story is concentrated in the post-2004 accession economies plus Iberia. Career strategy that does not account for this geographic divergence is leaving substantial real income on the table.
What this means for your career
The macro picture suggests four practical conclusions for the European professional in 2026.
1. Negotiate against total cost, not gross salary
If your employer pays €95,000 to give you €40,000, the negotiation conversation is not just about the gross number — it is about what fraction of total cost flows to you in net compensation and what fraction flows to social charges. In some structures (independent contractor relationships, certain executive packages, equity-heavy arrangements at US-headquartered firms), the loading rate can be reduced legally and meaningfully. The professionals who understand the cost structure their employer sees, and who negotiate against it, accumulate substantial real-income advantages over years. The professionals who only negotiate gross salary leave money on the table.
2. Choose employers whose cost structures favour you
A US-headquartered firm with European operations operates inside the same European labour cost structure as a European-headquartered firm — but it tends to compensate closer to US norms because its global pay-banding pulls upward. A remote-first firm based outside the EU may structure your contract through entities and jurisdictions that reduce the loading rate substantially. The compensation arbitrage between employer architectures is one of the most underused career levers available to senior European professionals.
The Job Search Networking Playbook covers the relationship work that supports these moves.
3. Close the productivity gap inside your own role
The productivity gap between European and US workers — 18% per hour and widening — is concentrated in digital sectors, which means it is concentrated in exactly the workflows AI tools are reshaping fastest. This is a structural problem at the institutional level. It is also an individual opportunity. The European professional who treats AI fluency as a first-order skill — not a CV-tweaking habit — can close the productivity gap inside their own role, multiply their output, and become substantially more valuable to their employer than the productivity statistics imply.
The right standard is not "I use ChatGPT for emails." It is "I have replaced one workflow I previously did manually with AI tools, end-to-end." The 12 Moves piece linked here covers this in detail.
4. Treat geography as a primary career variable, not a side input
The Warsaw–Frankfurt arbitrage is real. The Lisbon–London arbitrage is real. The Tallinn–Stockholm arbitrage is real. For the globally-mobile professional, where you work is now as important as how you work — and the legacy Western European hubs are no longer the only credible options for senior corporate roles. The most resilient European career strategies in 2026 are increasingly geographic in design, not just functional.
A final note
The European wage stagnation since 2008 is structural and likely durable. No individual professional can fix it. What individual professionals can do — and what the professionals navigating this decade well are doing — is treat the structural picture as planning input rather than passive context.
The macro is bleak. The micro is not. The two are different conversations, and the most useful career analysis is the one that holds both at the same time.
This analysis is part of The European Career Outlook Report 2026 by Orvo, the career intelligence platform for ambitious professionals. To receive the full PDF — pillar plus all five companion analyses — join our newsletter.
Republication permitted with attribution to Orvo and a link back to this article (Creative Commons Attribution 4.0).