
The European Career Outlook Report 2026
Why the Continent's Professionals Need a New Strategy
Data, frameworks, and the two levers that determine career resilience in a stagnating Europe.
When was the last time a European product genuinely caused excitement?
That's not a rhetorical question. It is the question this report is built around.
Try to answer it. Not a regulation. Not a sustainability target. Not a re-shoring announcement. A product — a thing a company shipped that made consumers somewhere in the world feel they were watching the future arrive. A new high-speed train. A grand bridge. A frontier AI model. A consumer device that millions of people queued for. A factory built somewhere unexpected, on a scale that made people travel to see it.
If the answer is taking you a while, that is the data.
In 1990, the European Union accounted for roughly 25.3% of global GDP, measured at current prices. By 2024, that share had fallen to 16.2%. By 2030, the IMF forecasts it will fall to 12.9% on a purchasing-power-parity basis. China's share over the same window has risen from 2.9% to 19.1%. The American share has held. Europe has been the only major bloc to lose roughly a third of its weight in the world economy in a generation. The European economy did not shrink in absolute terms; it grew by 72% between 1990 and 2024 in current prices. The world grew by more than 380% in the same period. Relative decline is the story, and relative decline is what determines living standards, wages, investment flows, and — eventually — career outcomes.
For professionals in the white-collar workforce, this isn't an abstract macro point. It is the underlying weather system every career strategy now has to operate inside. A consultant in Frankfurt, a product manager in Madrid, a financial controller in Dublin, a regulatory affairs lead in Brussels — each of them is, today, working in a region with structurally lower investment, lower productivity growth, and lower demographic vitality than their counterparts in the US, China, or India. They are not failing. They are not lazy. They are simply standing on a slower platform.
This report is for those professionals. Not for policymakers, not for European institutions, not for the people who set the rules. Their decisions matter — they sit at the top of every layoff, every relocation, every closed factory and every cancelled investment — but they are not the audience. The audience is the HR manager in Prague, the engineer in Krakow, the controller in Cologne, the marketing director in Lisbon. People whose careers are being shaped by decisions they did not make and cannot influence.
Our argument is simple. Europe is in structural decline, but the professionals working inside it have a specific opening that did not exist five years ago. AI fluency and visibility — the two compounding levers — now operate at the individual level in ways that work even when policy and capital don't. The professionals who thrive in 2026 will combine both. Those who wait for their institutions to fix the macro will be waiting a long time.
What follows is the data, the framework, and the playbook.
Executive summary
Seven findings, each independently sourced, designed to stand alone and to be quoted.
-
The UK ranks last on income per person when compared against all 50 US states. Most Britons think the UK ranks 7th. The reality, per the Institute of Economic Affairs working from IMF data, is 51st — below Mississippi, below Arkansas, below every single US state.
-
The European Union's share of global GDP has fallen from roughly 25% in 1990 to 16% in 2024, and is forecast to drop to 12.9% by 2030. The economy did not shrink. The world simply grew faster around it.
-
EU labour productivity per hour worked is now approximately 82% of the US level, having been roughly 72% in the early 2000s. The Bank of France attributes the bulk of the recent widening to digital-sector underperformance — meaning the productivity gap is now mostly an AI and software gap, not a manufacturing one.
-
In France, a €60,000 gross salary costs an employer €95,303 — but the worker takes home €39,501. The employer pays an additional 139% on top of net salary in social charges. Similar structures exist across Belgium, Italy, Germany, and Austria. Both halves of the equation push toward replacing humans: workers upskill out, employers automate or relocate.
-
DeepSeek's elite Tsinghua intern offers reach $19,000 per month — for undergraduates. ByteDance equivalents reach $26,000. In 2026, an elite Chinese frontier-lab intern out-earns most senior European tech professionals.
-
Twenty years ago, Poland's GDP per capita was 48% of the EU average. Today it is 82%, forecast to reach 97% of UK levels by 2030. Warsaw's metro area now ranks second in Europe for GDP per capita, behind only Central London. Poland is the only large European economy currently growing into rather than out of opportunity.
-
Auto China 2026 just wrapped (3 May): 1,451 vehicles, 181 world premieres, 380,000 sqm — the world's largest auto show. Tesla skipped it for the third year running. Volkswagen used the show to announce a 20-EV product offensive in China, explicitly framed as "regaining the lead." Chinese brands already hold above 10% market share in Norway, the UK, and Italy. The same pattern as in solar, wind, and AI chips: regulate first, build second, get overtaken.
These findings describe a continent in slow decline. The argument of this report is that they also describe a specific opening for the European professionals who can move faster than the institutions around them.
Section 1 — Force One: Industrial relocation and the policy-growth disconnect
In 2024, Bosch chairman Stefan Hartung said openly what most German industrialists were saying privately: the company was investing aggressively in China while closing factories and laying off workers in Europe. Bosch now operates 38 plants in China, employs 57,000 people there, and invests roughly €880 million per year in Chinese expansion. Its Suzhou campus alone covers 300,000 square metres — Bosch's largest presence outside Germany.
This is not a one-company story. BASF is moving production to Zhanjiang. ArcelorMittal has cut steel capacity across Europe and openly cited energy costs as the reason. Volkswagen is restructuring its German manufacturing footprint while expanding partnerships with Chinese firms it would previously have considered competitors. The chain is mechanical: Russian and Iranian geopolitical tensions push gas prices higher, energy-intensive European industry loses cost competitiveness, capital relocates to where energy is cheap and supply chains are dense. China is the answer to both.
European governments and EU institutions are aware of this trajectory. The deeper question is the model itself. The European Union is built on a centralised regulatory architecture that cascades over twenty-seven national economies — each with different industrial bases, demographic profiles, energy mixes, productivity levels, and growth potentials. A single regulatory framework, designed at the bloc level and applied uniformly, can be technocratically elegant and still produce poor outcomes when the economies underneath it are this diverse. Climate regulation lands differently in Polish coal regions than in Dutch services hubs. Labour rules optimised for German industrial productivity translate poorly to Greek tourism and Estonian software. The model is not failing because individuals inside it are failing — it is straining against the diversity of the economies it sits on top of.
The structural consequence is that long-range strategic intent is harder to articulate at the bloc level than in single-state systems. The formal mechanisms for setting direction (Commission, Council, Parliament, national governments, sectoral agencies) are numerous enough, and the consensus thresholds high enough, that the diagnostic capacity (acknowledging that something is wrong) outpaces the prescriptive capacity (agreeing what to do about it).
A personal note: the question Romania never asked
Fifteen years after Romania's 1989 revolution, a university professor of mine made an observation that has stuck with me ever since. The country, he argued, had never set itself a real national goal. Not a tactical one, not a five-year plan, but something simple and durable enough to organise priorities around. Something like: in twenty years, Romania will produce one Nobel laureate, in any field. Achievable. Specific. Long enough to outlive several governments. Big enough to organise university funding, research investment, education policy, and emigration retention around a single legible target. Small enough not to be ridiculous.
I have wondered for two decades why no Romanian intellectual or political class translated that kind of thinking into actual policy. Thirty-five years after the revolution, Romania is among the EU's least-developed members, with the second-largest emigration of any post-communist country. The Nobel was a stand-in for any concrete national ambition; the absence of any ambition was the real point.
The same observation now applies, in a more difficult form, to Europe as a whole.
China set goals. Many of them. The 2025 manufacturing strategy. The dual-circulation policy. The new infrastructure plans. Their solar, EV, AI chip, and high-speed rail leadership did not appear by accident — it was planned, funded, and executed against a horizon longer than any Western political cycle. Today, when you watch footage of Chinese cities — high-speed trains, automated ports, vertical farms, drone delivery, urban planning at a scale Europeans have not built in fifty years — the difference is not magic. It is twenty years of stated intent, executed.
What is Europe trying to become? The answer is dispersed across thousands of pages of regulations, frameworks, taxonomies, transition plans, sustainability mandates, and stakeholder consultations. Somewhere in that material, in principle, is a vision. In practice, it is hard for any European citizen, journalist, or business leader to state in a single sentence — and that is itself the structural problem.
This matters for careers because every relocation decision, every layoff round, every restructuring plan made by a multinational in Europe rolls downhill from the strategic indeterminacy at the bloc level. When the regulatory framework above firms is detailed but directional intent is unclear, firms default to what they know how to do — defer to compliance, optimise for tax efficiency, and quietly relocate the parts of the business that benefit from being elsewhere.
The next wave: not just AI, but robotics
The relocation story is not finished. It is only halfway through.
We have spent thirty years exporting heavy manufacturing on the grounds that it was too polluting, too low-margin, or too unionised, comforting ourselves with the belief that Europe would specialise in higher-value knowledge work. The trade has not gone as advertised. The knowledge work has not absorbed the displaced industrial workforce — partly because the EU never had the capital depth or the labour mobility to make the transition smooth, and partly because the knowledge work itself is now being automated.
The next wave of automation is not just AI. It is also robotics. Elon Musk has stated Tesla's intention to ship ten million Optimus robots per year, both B2B and B2C. Amazon has automated significant portions of its warehouse fleet. Major ports — Rotterdam, Hamburg, Shanghai — have been automated to the point that the longshoreman as a job category is in structural decline. Drone delivery is moving from pilot programmes into production. Self-driving fleets are being trialled at scale in the US and China. The trucking industry — one of the largest sources of employment in any developed economy — is on a five-to-fifteen year clock.
European workers are being told, implicitly, that they will move from industrial jobs to office jobs. The next wave is automating the office jobs at the same time. The question Europe is failing to ask is what comes after. China is asking it: their answer is becoming the global supplier of the automation itself, and exporting both the hardware and the integration layer to anyone willing to buy it. The American answer is to be the global supplier of the AI software stack, and to absorb relocated manufacturing through subsidy programmes (the Inflation Reduction Act, the CHIPS Act). Europe's answer is, so far, more regulation and more import tariffs.
Globalism is over. Ecosystems are next.
The model that defined the last thirty years was globalism: long, thin supply chains optimised across countries to extract maximum efficiency from comparative advantage. That model is being replaced — not by deglobalisation, exactly, but by something different. The new model is ecosystems: dense clusters of companies, universities, research institutions, suppliers, and capital co-located in single regions, each producing the next generation of a sector's leading firms.
China's EV cluster around Shenzhen is an ecosystem. Silicon Valley is an ecosystem. Boston Dynamics + MIT + Boston biotech is an ecosystem. The interesting feature of ecosystems is that they cannot be replicated by regulation. They emerge from sustained co-location, sustained investment, and sustained vision over decades. They cannot be ordered into existence by a Commission directive. Either you have one, or you don't.
Europe has a few — life sciences in Cambridge and Basel, fashion in Milan, finance in London — but it has notably few in the categories that will define the next twenty years: AI, robotics, automated transport, semiconductors, advanced energy. The EU's industrial strategy in these areas reads as an attempt to legislate an ecosystem into existence. Ecosystems do not work that way.
For the white-collar professional, the practical takeaway is that the relocation pressure will continue, the automation pressure will accelerate, and the underlying European strategy for what to do about either is, today, absent. This is the macro environment. The next three forces describe its specific consequences.
Section 2 — Force Two: The AI Pipeline
The simplest framing of Europe's AI gap is about money: in 2024, US private AI investment reached $109 billion against €8 billion in Europe. The funding ratio is roughly twelve to one. This is the version that gets cited most often, and it understates the structural problem.

The deeper issue is that AI capability is not a single resource but a pipeline of four resources, each with a different replacement cycle. Money is the easiest to replace. Compute is harder. Models are harder still. Talent is the hardest of all. Europe is short of all four, and the shortages compound on each other.
The talent pipeline: a generational lead time
China graduates approximately 3.57 million STEM students every year — about 40% of all university degrees. The United States graduates roughly 800,000. Germany, the United Kingdom, and France combined produce approximately 800,000, matching the US figure between three of Europe's five largest economies.
At doctoral level, the comparison is starker. By 2025, China is producing approximately 77,000 STEM PhDs annually against approximately 40,000 in the US. Georgetown's Center for Security and Emerging Technology has shown that if international students are excluded from the US count, the China-to-US ratio approaches three to one. By 2030, China and India are forecast to produce roughly 60% of global STEM graduates between them. Europe's projected share is 8%.
The thing about talent pipelines is that they cannot be rebuilt in a hurry. A government cannot announce in 2026 that it would like more STEM graduates by 2027. Today's PhDs were 18-year-olds in 2014. Today's 18-year-olds were 6-year-olds in 2014. Cultural attitudes towards STEM, university funding decisions, secondary-school maths curricula, immigration policy, and post-doctoral retention programmes — all of them operate on a horizon of fifteen to twenty-five years. Whatever Europe decides to do about its talent pipeline today will not show up in the workforce until the late 2030s. The pipeline is a generational investment, and Europe is fifteen years late on the decision.
The model layer: ten frontier teams versus two
China runs more than ten companies actively building frontier AI models — DeepSeek, Alibaba's Qwen, Tencent's Hunyuan, ByteDance's Doubao and Seed, Huawei's Pangu, Baidu's ERNIE, Kuaishou's Kling, Zhipu, Moonshot, and MiniMax, among others. Europe has two with frontier output worth taking seriously: Mistral, building large language models in Paris, and Black Forest Labs, producing the Flux family of image models in Germany. There is a thin layer of strong specialists beyond that — Aleph Alpha in enterprise, ElevenLabs in voice, Synthesia in video, Helsing in defence — but it does not change the structural picture. Europe has two frontier teams. China has more than ten.
April 2026 case study: Mistral 3.5 lands
In late April 2026, Mistral released Medium 3.5, a 128-billion-parameter dense model with a 128,000-token context window — priced at $1.50 per million input tokens and $7.50 per million output tokens. Within hours, industry analysts were comparing it to seven Chinese open-source models, all cheaper, all with longer context windows, several with materially better benchmark performance. DeepSeek V4 Flash ran the same workload at roughly seventeen times less cost. The architecture Mistral shipped was acknowledged by reviewers as similar to Llama 2, released three years earlier. The same week, xAI announced it had begun training Grok 5 on Colossus 2, designed to support a ten-trillion-parameter model — twenty times the size of Grok 4.3. The signal is not that Mistral is bad. It is that Europe's flagship AI lab can ship its best work and still be priced out, out-architected, and out-scaled by competitors operating at a different cadence.
The compute layer: a two-year backlog
The model layer sits on a compute layer that is, today, the bottleneck of the entire AI economy. The hyperscalers are buying every advanced chip they can get; the order books extend two years out. The grid bottleneck is real: gas turbine orders for US data-centre power are now backlogged through 2027. Roughly a trillion dollars of capital expenditure has been committed to AI infrastructure over the next four years. None of it is being committed in Europe at meaningful scale. The chip foundries are in Taiwan, Korea, and increasingly the US. The hyperscale data-centre buildouts are in Northern Virginia, Texas, Arizona, and across China. Europe imports the compute it uses, mostly from US clouds — which means European AI capability is structurally dependent on infrastructure built and owned elsewhere.
Why the pipeline gap is bad — but not the end of the story
If this section ended here, it would be unrelievedly grim. But the European AI story has one important saving grace: you do not need to build AI to use it.
Frontier models from OpenAI, Anthropic, Google, DeepSeek, and Mistral are accessible globally through APIs. A European company adopting Claude or GPT-4 today operates with the same model capability as a Californian competitor adopting the same model the same week. The competitive question is not who builds the best model; it is who deploys it fastest and most thoroughly inside their organisation. Europe has lost the race to be the leading producer of AI. The race to be a leading user of AI is open, and it is the race that determines productivity, margin, and competitiveness over the next decade.
This is a critical reframe. The institutional AI gap (talent, compute, capital) determines Europe's place in the global AI supply chain. The adoption gap — how quickly European firms embed AI into actual workflows — determines whether European companies remain competitive against US and Chinese firms in their own markets. The first is a generational policy problem. The second is a quarterly management problem. They have very different timeframes, very different actors, and very different solutions.
For the individual European professional, this distinction matters enormously. You cannot fix the model gap. You can absolutely contribute to closing the adoption gap inside your own organisation, in your own role, this quarter. Section 6 develops what that looks like in practice.
Section 3 — Force Three: The compensation trap
If Europe were merely a slow-growth region with stagnant wages, professionals would have a clear strategy: work harder, change employer, change country, accept the trade. The actual situation is more difficult than that. European wages are low for the worker and high for the employer. Both halves of the compensation equation push toward replacing humans with machines or moving the work elsewhere.
The worker side: stagnation against history
UK GDP per capita is approximately £11,000 per person lower than it would have been had pre-2008 growth trends continued. That is not a forecast. It is a foregone pay rise — measured against what was already in motion. The UK ranks 51st on income per person when compared against all 50 US states plus the UK; the Institute of Economic Affairs documents that most Britons believe the UK ranks roughly 7th, and the gap between perception and reality is itself part of the problem. Polling that finds 87% of Britons want growth-focused policy and 40% believe the UK economy has no major strengths at all describes a population that knows something is wrong but cannot name it precisely.
Twenty years ago, Poland's GDP per capita was 48% of the EU average. Today it is 82%, with forecasts suggesting 97% of UK levels by 2030. Warsaw's metropolitan area now ranks second in Europe for GDP per capita, behind only Central London. Several Polish regions are now richer than several British regions. This is the rare positive data point in European compensation, and we will return to it in Section 5 — because it changes which European countries make sense as career destinations going forward.
Meanwhile, the price of frontier technical talent has detached from European salary norms. According to widely-reported leaked offers, DeepSeek pays elite Tsinghua "Yao Class" interns approximately ¥5,500 per day, equivalent to roughly $19,000 per month. ByteDance equivalents reach $26,000 per month. Senior Chinese AI engineers are reportedly choosing offers from Chinese frontier labs over $500,000 packages from Silicon Valley, applying a 1:3 purchasing-power ratio in the comparison. The implication for European tech is uncomfortable: in 2026, an elite undergraduate intern at a Chinese frontier lab out-earns most senior European software engineers and product managers.
The employer side: a continent of high-cost labour
The story from the worker's side is well-told. The story from the employer's side is the other half, and it has been less discussed. The combined cost of employing a salaried worker in Western Europe is materially higher than the gross salary the worker sees, and much higher than the net salary they take home. This is because of the structure of social contributions, employer-paid taxes, mandatory benefits, and statutory protections that Europe layers on top of payroll.
A widely-circulated April 2026 analysis (drawing on French INSEE data and Eurostat-derived comparisons) made the structure unusually clear. For a €60,000 gross salary across the major Western European economies, the total cost to the employer and the take-home pay for the worker break down approximately as follows:
| Country | Gross salary | Net salary (worker take-home) | Total employer cost | Employer extra (% over net) |
|---|---|---|---|---|
| France | €60,000 | €39,501 | €95,303 | +139% |
| Italy | €60,000 | ~€35,963 | ~€88,326 | +146% |
| Sweden | €60,000 | ~€35,279 | ~€77,618 | +120% |
| Germany | €60,000 | ~€39,679 | ~€74,724 | +88% |
| Spain | €60,000 | ~€39,026 | ~€79,637 | +104% |
| Netherlands | €60,000 | ~€43,678 | ~€77,004 | +76% |
| Switzerland (non-EU reference) | €60,000 | ~€50,117 | ~€68,387 | +36% |
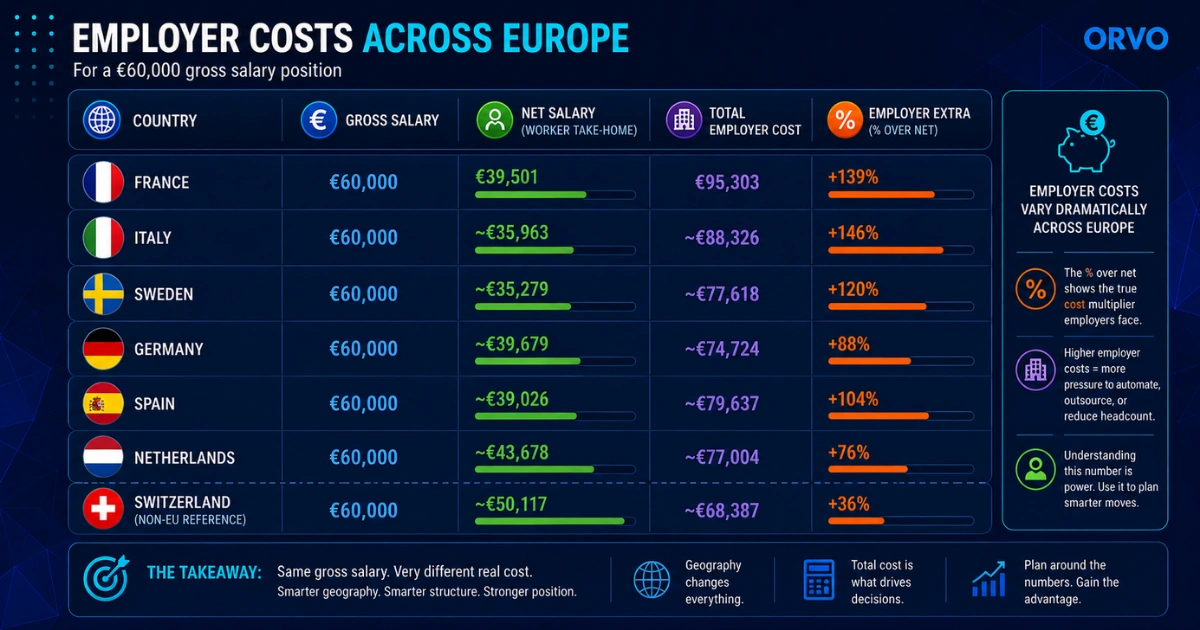
The numbers vary across countries, but the structural pattern is identical. The European worker sees a take-home wage in the high €30,000s for a €60,000 gross. The European employer pays an additional 70–150% on top of net wage in social charges, taxes, and contributions. The worker feels poor. The employer feels expensive. Both halves of the equation push toward replacement.
This is part of why the AI adoption rate inside European firms matters so disproportionately. When a competent European white-collar role costs an employer €80,000–€95,000 fully loaded, and an AI-augmented worker can do the work of two such roles for the same total cost, the math becomes brutally simple. The argument is not whether to replace humans with AI; the argument is which humans, in which roles, in which sequence.
The productivity gap that ties it together
EU labour productivity per hour worked is now approximately 82% of the US level, having been roughly 72% in the early 2000s. Convergence happened. Then it stopped. Since 2022, the gap has been widening again — the European Central Bank attributes much of the recent divergence to the post-2022 energy shock and to weaker private investment. The Bank of France's analysis, building on the Draghi Report (2024), points specifically at the digital sector — meaning the productivity gap is now disproportionately an AI-and-software gap, not an industrial one.
In plain terms: the average European worker is 18% less productive per hour than the average American worker, and the gap is concentrated in exactly the sectors where AI offers the largest potential productivity gains. This is, paradoxically, a hopeful framing. The gap is not metaphysical; it is mechanical, and mechanical gaps can be closed by mechanical interventions. AI fluency at the individual level, deployed at scale within European firms, is the most plausible route to closing it.
Section 4 — Force Four: The geographic concentration problem
Europe's labour market is not a single market. It is a small number of dense hubs separated by long, thin corridors of activity. For the white-collar professional, the geographic structure of the European economy is as important as the structure of any individual industry inside it.
The 12-city problem
Meaningful concentrations of global-grade corporate roles exist in roughly twelve European cities: London, Paris, Berlin, Munich, Frankfurt, Amsterdam, Dublin, Madrid, Barcelona, Milan, Stockholm, and Zurich. Brussels, Luxembourg, and Warsaw act as supplementary financial and regional hubs. Outside this list, the density of senior international roles falls off sharply. There are excellent jobs in Lyon, Hamburg, Edinburgh, Lisbon, Prague, Krakow, Tallinn, and a handful of others — but not in the same density and not at the same global-grade level.
The compound effect is a structural fragility that European workers feel and US workers don't. If you are laid off in San Francisco, you can move to Seattle, Austin, New York, or Boston without leaving your country, your tax system, your social security, or your professional network. If you are laid off in Lisbon, you cannot move to Stockholm without a substantial relocation. The European job market is twelve cities and a long tail. Recovery from a layoff outside the twelve is materially harder than the equivalent move in the US.
Capital concentration
Roughly 90% of European venture capital sits in London. Outside the UK, capital flight to Delaware is now routine. Lovable, Europe's fastest-growing AI company, has Swedish founders, a Swedish team, and a Delaware C-corporation registration. The capital follows the venue with the cleanest legal and financial infrastructure, and that venue is increasingly outside the EU.
A note on the European VC gap, and why it may matter less than it looks
Even Europe's headline venture-capital gap may matter less in two years than it does today. The venture model funded labour and time — twelve-month product cycles, two engineers and an idea. AI is collapsing both. With Claude Code, with MCP servers wired into marketing infrastructure, with AI-native shipping pipelines, the case for funding two engineers in Prague for twelve months looks structurally weaker than it did in 2022. The likely next decade: VCs converge on the private-equity model — fewer, larger investments in companies with AI-native operations as standard. Europe's startup-funding gap may close not because Europe gets stronger, but because the startup-funding model itself contracts.
Where you work is now as important as how you work
The classical career-planning question was what should I do? The 2026 question is what should I do, and from where? Geography is no longer a neutral input to a career — it is itself an asset. Working from Warsaw rather than Frankfurt is a different career bet, with a different cost base, a different talent pool, and a different growth trajectory. Working from a Polish hub for a US-headquartered firm is a different career bet again, with US compensation norms and Eastern European cost of living.
Most European career advice still treats geography as a side variable: where do you happen to live, where can you reasonably commute, where would you tolerate moving? The data above suggests it should be treated as a primary variable. The Polish convergence story alone is enough to justify a serious geographic re-evaluation for any European professional whose role is portable.
Section 5 — The adaptability gap
The four forces above describe the macro environment. They do not, on their own, explain why Europe is failing to respond to it. The deeper pattern — and the original lens of this report — is what we call the adaptability gap. Europe's institutions cannot adapt at speed. The continent regulates first, builds second, and is consistently outpaced by competitors who do the opposite.
Three illustrative cases.
The climate regulation case. Europe led the global climate regulatory agenda in part to constrain China's coal-driven industrial growth. China responded by becoming the world's leading producer of solar panels, wind turbines, and electric vehicles. European industry got higher energy costs and a tighter regulatory perimeter; China got the green-energy supply chain. The same regulations that were designed to slow a competitor accelerated it.
The AI chip export case. US export bans on Nvidia chips to China were intended to halt Chinese AI progress. Within two years, Huawei produced a competitive domestic chip; DeepSeek now runs on it and serves competitive frontier models at roughly ten times less cost than US-stack equivalents. Europe was not the architect of those export controls, but it imported the assumption — that constraining a competitor would buy time. The competitor used the time to remove the constraint.
The auto industry protection case. EU emissions regulation was designed to give European OEMs a transition window into electric vehicles. Chinese manufacturers built the EV supply chain instead. Auto China 2026, which wrapped on 3 May, ran 1,451 vehicles across 181 world premieres and 380,000 square metres — the world's largest auto show. Tesla skipped it for the third consecutive year. Volkswagen's response, announced at the show: 20 new electric vehicles launching in China this year, expanding to 50 by 2030, framed by the company itself as "regaining the lead." Chinese passenger-car market share is already above 10% in Norway, the UK, and Italy. Forecasts suggest Chinese brands could capture 15–25% of the European market within four to five years and potentially over 30% within a decade. The European response: import tariffs on Chinese EVs.
The pattern repeats. Europe sets rules expecting them to constrain external competitors. The competitors absorb the constraint, accelerate, and overtake. Europe is left with the rules, the slowness, and the lost market. This is what Merz meant by "world champion of over-regulation," and it is what Macron meant by Europe's only economic challenge being China.
Why this matters for individual careers. Institutional rigidity is bad news for European employers competing with Chinese and American firms. But it creates a specific opportunity for individuals who can move faster than the institutions around them. You do not need EU permission to learn an AI tool. You do not need a building permit to build a portfolio. You do not need a tariff to ship a side project.
The adaptability gap is a regional liability and an individual opportunity at the same time. The career-resilient European professional in 2026 treats the gap as personal asymmetry, not personal handicap.
Section 6 — The opportunity within the decline: the AI-Empowered European Professional
There is a real, measurable productivity gap between the average European worker and the average US worker — about 18% per hour, concentrated in the digital sector. Most analysis attributes this gap to capital depth, technology investment, regulatory drag, and labour market flexibility — all factors that operate at the institutional level and are slow to change. We argue that the productivity gap is also closeable at the individual level. Europeans cannot fix EU policy on a quarterly cycle. They can change how they work in the next thirty days.
The lever is AI fluency. Not as a slogan — as the actual operating system of a 2026 knowledge worker.
A thought experiment in two marketing teams
Imagine two competing companies, each with a hundred-person marketing organisation. Both are skilled. Both have similar budgets. Both have access to the same AI tools — because, as established in Section 2, AI tools are accessible globally regardless of where the AI is built.
Company A has integrated AI deeply. Their marketers run multi-channel campaigns through MCP-connected tools that fire off in scheduled workflows overnight. Their copy is generated, edited, A/B tested, and re-generated within an hour. Their analytics are queried in natural language. Their creative is iterated through image and video models inside the ad-trafficking platform. Each marketer ships approximately three to five times the work of a 2023 baseline.
Company B uses AI sporadically. Their marketers each have a ChatGPT subscription. They use it for drafting some emails and brainstorming taglines. The campaign workflows still run on the same ticketing system they used five years ago. Their average marketer ships roughly the same volume as in 2023, perhaps 10% higher.
After one year, the question is not whether Company A wins. It is how long Company B has before it cannot win.
This is comparative advantage in the classical sense — the same logic Adam Smith and David Ricardo applied to nations specialising in cotton or wheat. The companies (and the workers) that capture early AI fluency capture compounding margin advantages over those that don't. Late adopters do not simply face slower growth; they face a structural disadvantage that grows wider every quarter the gap is open.
The Curating Economy framework
In a 2024 essay we argued that the knowledge economy was transitioning into what we called the Curating Economy: knowledge workers shifting from creators of content and analysis to curators of AI-generated work. Two years on, the prediction has aged well, with one important refinement. The curators who win are not the ones who use AI most. They are the ones who use it most precisely.
This is a language story. AI runs on natural language. If your vocabulary is small, your prompts are small, and the output you can extract is small. The difference between a worker who writes "make this better" and a worker who can articulate exactly what is wrong with a draft, in what register, with which audience in mind, is enormous — measured in output quality and measured in time saved.
A useful metaphor: think of the difference between someone who responds to everything funny with "lol" and a writer who can construct an entire scene in which a character laughs — describing the kind of laugh, the body language, the silence afterwards, what it told the other characters in the room. Both are responses to humour. One produces almost no information. The other produces a literary set-piece. AI is the second writer, asked to produce work matching the precision of your prompt. If your prompt is "lol," your output is "lol."

This has consequences for which skills matter most. The professions that have always rewarded precise language — product management, strategy, communications, journalism, law, consulting — are now compounding that reward with AI leverage. The professions that rewarded narrow technical precision but accepted communication weakness — particularly engineering — are seeing their leverage redistribute.
The vibe-coding shift inside Google
If you want a concrete signal of how fast the role definition is moving inside the most observed companies on the planet, look at Google. In November 2025, a product manager working on Google Search's AI Answers said publicly that his entire team — product managers, designers, engineers, and even executives — vibe-codes now, and that demos have replaced product requirements documents as the primary artefact of planning. By April 2026, Google, Figma, and Perplexity were reportedly running 45-minute vibe-coding rounds in product manager interviews, where candidates build a working prototype with Cursor live while interviewers watch. In February 2026, Naval Ravikant, posting to roughly three million followers, called product managers who vibe-code the new power players in tech, and described the best ones as "Full-Stack Product Leads" who own everything from user insight to working prototype.
This is not noise. It is a structural shift in what the most-watched product organisations consider a baseline competency. Two years ago, a PM was a planner who depended on engineers to execute. Today, the PM with high AI fluency executes alongside the engineers — or before them. The role has compressed. The middleman layer between idea and prototype has thinned. PMs who could not previously act on their own ideas now can.
The interesting part is that this shift favours skills product managers were already supposed to have: planning, systemic thinking, the ability to articulate intent in language. AI rewards these skills with leverage. The PMs who were strong communicators were already good at their old job. They are spectacular at the new one.
The same shift is happening, in different forms, in marketing, design, finance, analytics, and consulting. The pattern is the same: roles that rewarded precise communication are now rewarding it more.
What AI-Empowered actually looks like in practice
It is not "I use ChatGPT to write emails." That is a CV-tweaking habit, not a career strategy.
AI-Empowered work has a specific shape. It is the product manager who shows up to planning with a working prototype rather than a PRD. It is the marketer who runs a full multi-channel campaign through MCP-connected tools without a campaign manager. It is the analyst who builds the dashboard themselves rather than queuing a request to a BI team. It is the designer producing at ten times the throughput because the second draft is generated, not drawn. It is the consultant whose first deliverable in week one is a working artefact, not a deck.
The throughline: roles where the output is what is measured, not the process.
Why the burden falls on the employee
Most European employers are cost-cutting first and training second. Waiting for your company to train you in AI is a losing strategy in 2026. The professionals pulling ahead this decade are doing the upskilling on their own time, with their own tools, in their own way. They are reading the documentation, building the side projects, joining the communities, paying for the subscriptions, and making the mistakes — at their own cost.
This is unfair. It is also reality. The companies that invest heavily in workforce AI training tend to be the ones that already have a compounding advantage. The ones that do not, do not. If you are working at a slow-moving European corporate, the adaptability gap shows up first on your training budget.
Why this works particularly well in Europe
The optimistic case is buried inside the pessimistic one. Institutional slowness is a moat for the individual who moves fast inside it. If your employer cannot ship a new product line for eighteen months but you can ship a working prototype in a week, you become disproportionately visible inside your own organisation. The asymmetry favours you.
In a fast-moving environment, fast-moving individuals get drowned out. In a slow-moving environment, fast-moving individuals stand out. Europe's institutional rigidity is a tailwind for any professional willing to move at a different speed.
Section 7 — The European Career Outlook Index (ECOI)
The ECOI is a directional scoring framework for assessing the resilience of a corporate role in 2026 Europe. It is not a forecast and it does not predict whether any individual will keep their job. It scores the exposure of the role class itself to the four converging forces, weighted by the individual-level levers that mitigate them.
Variables and weights
| # | Variable | Source | Weight |
|---|---|---|---|
| 1 | Industry layoff trend (24-month, EU-weighted) | layoffs.fyi + Hays Salary Guide | 20% |
| 2 | Geographic concentration exposure (industrial relocation + 12-city dependency) | Eurostat + EU Commission | 15% |
| 3 | AI displacement exposure | WEF Future of Jobs 2025 + OECD AI Occupational Exposure Index | 20% |
| 4 | Salary growth vs PPP-adjusted global benchmarks | Hays + Mercer + IMF | 10% |
| 5 | Hiring momentum (open roles vs prior year) | Indeed Hiring Lab | 15% |
| 6 | Visibility & cross-functional surface area | Orvo Visibility Principle | 20% |
Why these weights
Visibility is weighted equally with the strongest macro variables — AI exposure, layoff trend — for one reason. The argument of this report is that individual positioning matters as much as industry-level forces in a stagnating environment. If we weighted visibility at 5%, we would be saying the macro determines everything; if we weighted it at 50%, we would be saying ignore the macro. Twenty per cent is the honest balance.
Salary growth carries a lower weight (10%) because European stagnation is universal — it applies to almost all roles and therefore differentiates them poorly. Hiring momentum carries 15% because it is the cleanest leading indicator of role health.
Score bands
- 80–100 — Highly resilient. Cross-functional senior product managers in regulated industries, healthcare clinical leadership, defence and security technical roles, EU compliance specialists, regulatory affairs heads.
- 60–79 — Resilient. Cross-functional individual contributors in stable sectors, mid-management roles with stakeholder breadth, customer-facing senior roles in growth industries.
- 40–59 — Exposed but recoverable. Most generalist white-collar roles in mature industries — middle-tier finance, mid-level marketing, generalist HR business partners.
- 20–39 — Highly exposed. Manufacturing technical roles in Germany and Italy, mid-tier banking roles in London, marketing roles dependent on advertising-funded business models, sales roles in industries facing structural decline.
- 0–19 — Acute risk. Energy-intensive manufacturing operatives, low-visibility individual contributors in declining sectors, process-heavy back-office roles with no cross-functional interface.
Limitations
The ECOI is directional, not predictive. It does not forecast individual job loss. It estimates the exposure of a role class to structural forces. Individual outcomes within a role class can vary substantially based on visibility, relationship capital, AI fluency, and timing. We are explicit about this because pretending the index is more rigorous than it is would damage its credibility — the honest version is more useful than the impressive one.
For the full per-variable scoring methodology, see the ECOI Methodology Deep Dive.
Section 8 — ECOI scores by role and industry
Applied to 25 representative corporate roles across six industries, the index produces the rough rankings below. Scores are illustrative and assume the role's median holder rather than its top or bottom decile.
Top 5 most resilient roles (2026)
- Senior Product Manager, Regulated Industry (financial services, healthcare, energy) — High AI fluency multiplier, high visibility surface, regulatory moat against full automation. ECOI: 84
- Head of Compliance / Regulatory Affairs (multinational) — Specific regulatory expertise compounds with visibility; not outsourceable to non-EU jurisdictions. ECOI: 82
- Clinical Project Lead, Pharmaceutical — Cross-functional, regulatory, person-dependent; pharma is the rare European industrial bright spot. ECOI: 80
- Cross-functional Programme Manager, Enterprise Software — Stakeholder breadth, AI leverage available, senior visibility. ECOI: 78
- Senior Strategy / Corporate Development, Multinational — High visibility, executive proximity, cross-business surface, AI-amplified output. ECOI: 77
Top 5 most exposed roles (2026)
- Mid-level back-office banking, London / Frankfurt / Paris — Process-heavy, well-documented workflows, prime AI replacement target, sector consolidating. ECOI: 26
- Mid-tier manufacturing engineering, Germany / Italy / France (energy-intensive sub-sectors) — Industrial relocation exposure, capacity cuts, low geographic mobility. ECOI: 28
- Generalist HR business partner, mid-corporate — Process-heavy, AI-exposed, low cross-functional differentiation. ECOI: 32
- Junior to mid-level marketing in advertising-funded industries — Budget pressure, AI capability erosion, hiring momentum negative. ECOI: 34
- Mid-tier auto industry technical roles — Structural decline of European OEMs against Chinese competitors. ECOI: 36
Industry-level summary
| Industry | Average ECOI | Direction |
|---|---|---|
| Pharmaceutical / Healthcare | 71 | Stable to improving |
| Defence and Security | 69 | Improving (Helsing-driven AI capacity, geopolitical demand) |
| Professional Services (top tier) | 65 | Stable, AI compresses lower tiers |
| Tech (employed by US-headquartered firms in EU) | 62 | Mixed, depends on parent strategy |
| Public Sector (senior, EU institutions) | 58 | Stable but stagnant |
| Financial Services (universal banks) | 51 | Compressing |
| Tech (EU-headquartered firms) | 48 | High variance, declining median |
| Manufacturing (energy-intensive) | 36 | Declining |
| Media / Advertising | 34 | Declining sharply |
| Retail / Hospitality back-office | 32 | Declining |
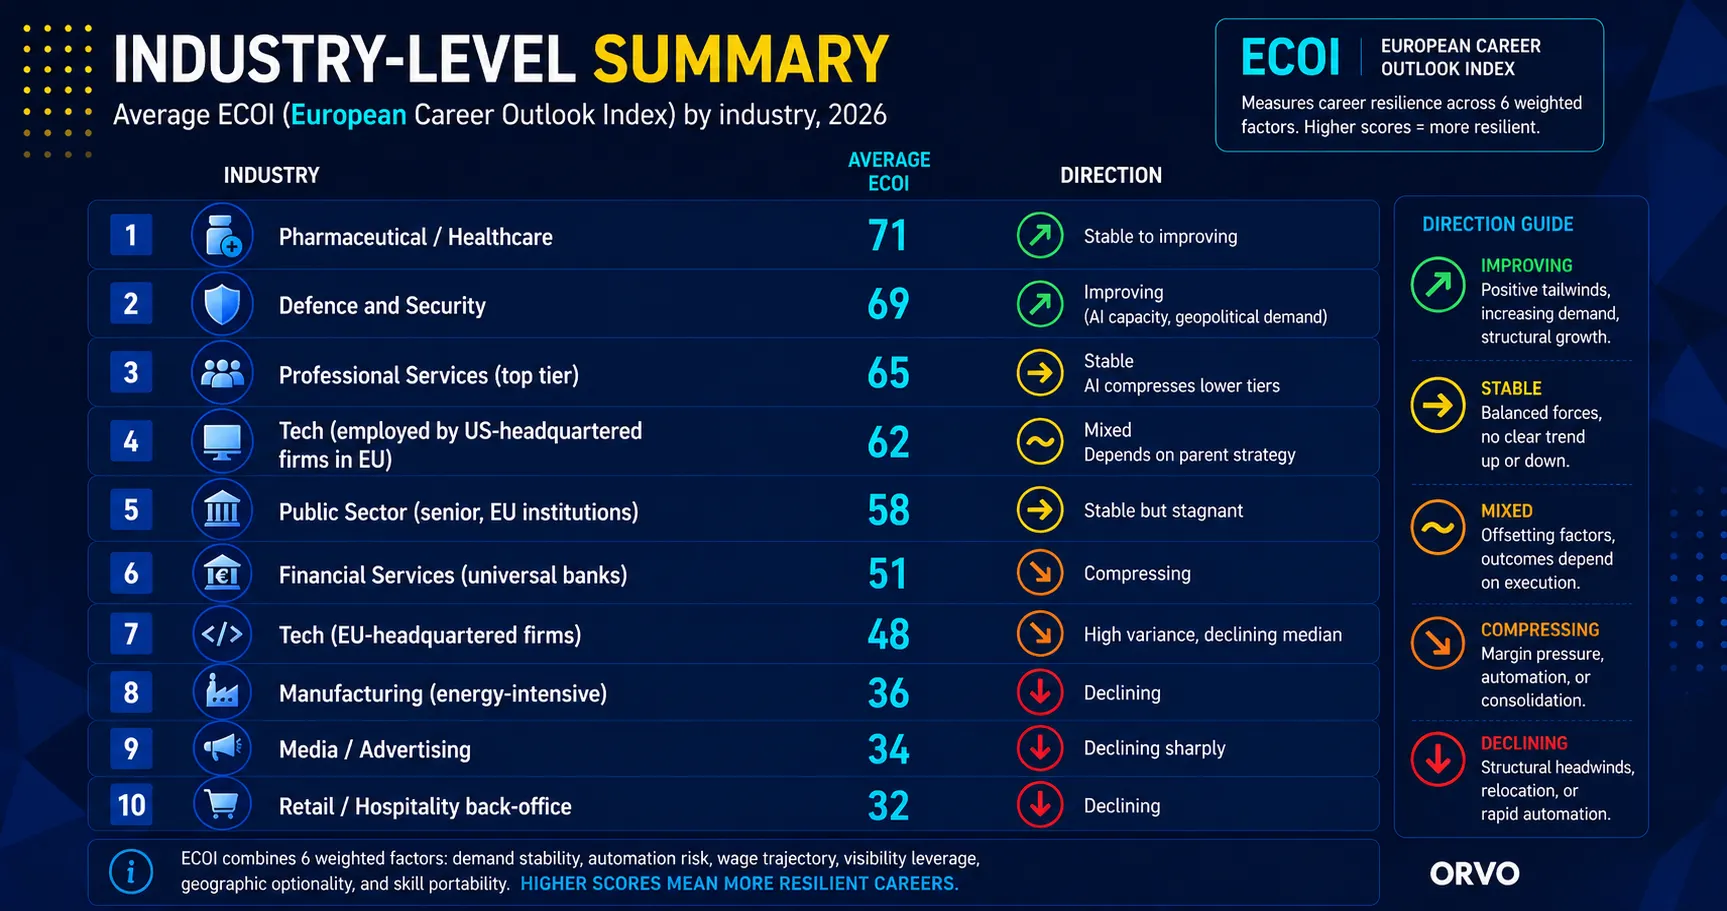
Across the 25 roles scored, the median ECOI is 53. The spread is wider than in equivalent US analyses, reflecting the geographic concentration problem. Resilience in Europe is increasingly bimodal: high in a few hubs and a few protected sectors, low almost everywhere else.
Section 9 — The Visibility Principle: why the person, not the JD, decides what survives
Every European corporate professional has watched this happen at least once. A team of capable people, doing competent work, gets restructured. Some keep their jobs. Some don't. The ones who keep their jobs are not always the highest performers. They are almost always the most visible.
The reason is structural, not political. We call this pattern the Visibility Principle, and it is the load-bearing argument of this report.
The Visibility Principle (Orvo, 2026): In structurally stagnant economies, layoffs and outsourcing concentrate not on the lowest performers but on the lowest-visibility roles. The professional who survives reorganisation is not the one with the best technical skills — it's the one whose role has become inseparable from their relationships, their visibility, and their ability to navigate the organisation.
The legibility trap
When European corporations outsource — and they do, at scale and routinely — they outsource cost-centre roles. The ones whose value is procedural, whose process is documented, whose outputs are measurable in spreadsheets, and whose hand-offs to other functions are formalised. These roles can be moved because they have been pre-translated into instructions that another team, anywhere in the world, can pick up. That is what made them efficient in the first place. It is also what makes them outsourceable.
We call this the legibility trap. A role becomes outsourceable in the same act that makes it legible to a process manual. A role stays in-house when its execution is illegible to anyone who has not lived the relationships behind it. The legibility trap is the mechanism behind the Visibility Principle.
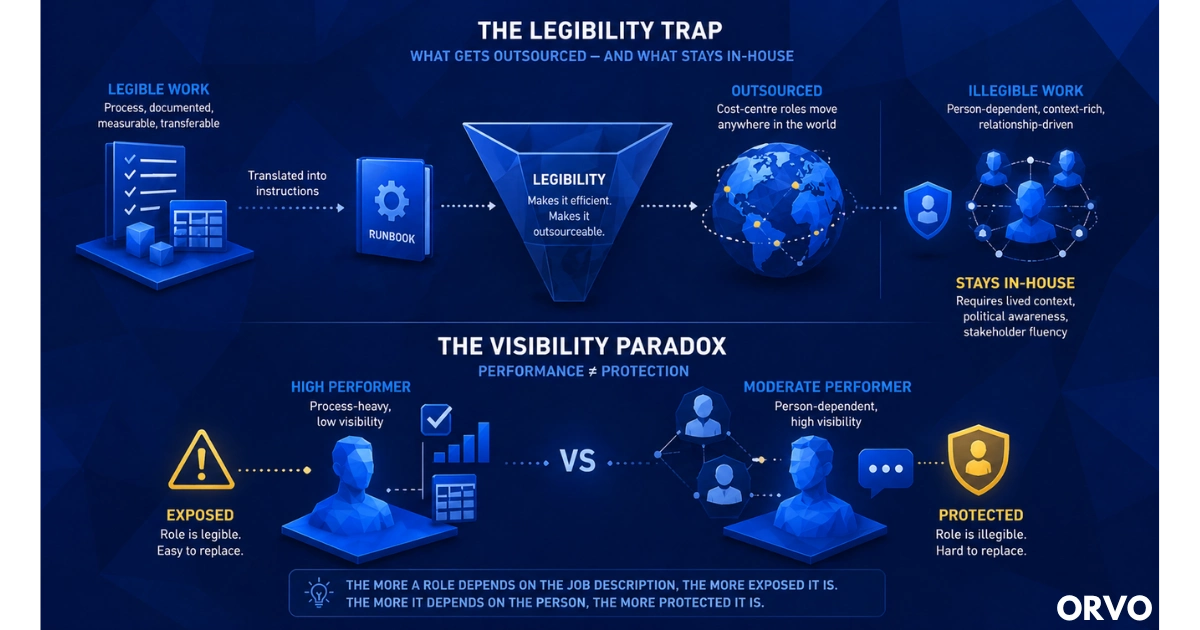
What stays in-house, in expensive Western European cities, is the work that depends on the person rather than the job description. The work that requires political awareness, stakeholder fluency, cross-functional influence, and the kind of context that takes years to build and cannot be transferred via a runbook.
The visibility paradox
The implication is uncomfortable for most career advice. The high performer in a process-heavy, low-visibility role is more exposed than the moderate performer in a visible, person-dependent role. Performance does not protect you when the metric of evaluation is the role itself, not the person filling it.
This is why visibility is the load-bearing variable in the ECOI. A role that has been fully proceduralised is a role whose holder can be replaced. A role whose execution depends on relationships, context, and political surface area is one that survives reorganisations because the cost of replacing the person is real and visible.
The visibility × AI fluency matrix
Visibility and AI fluency are multiplicative, not additive. Their interaction defines four categories of professional, with very different career trajectories:
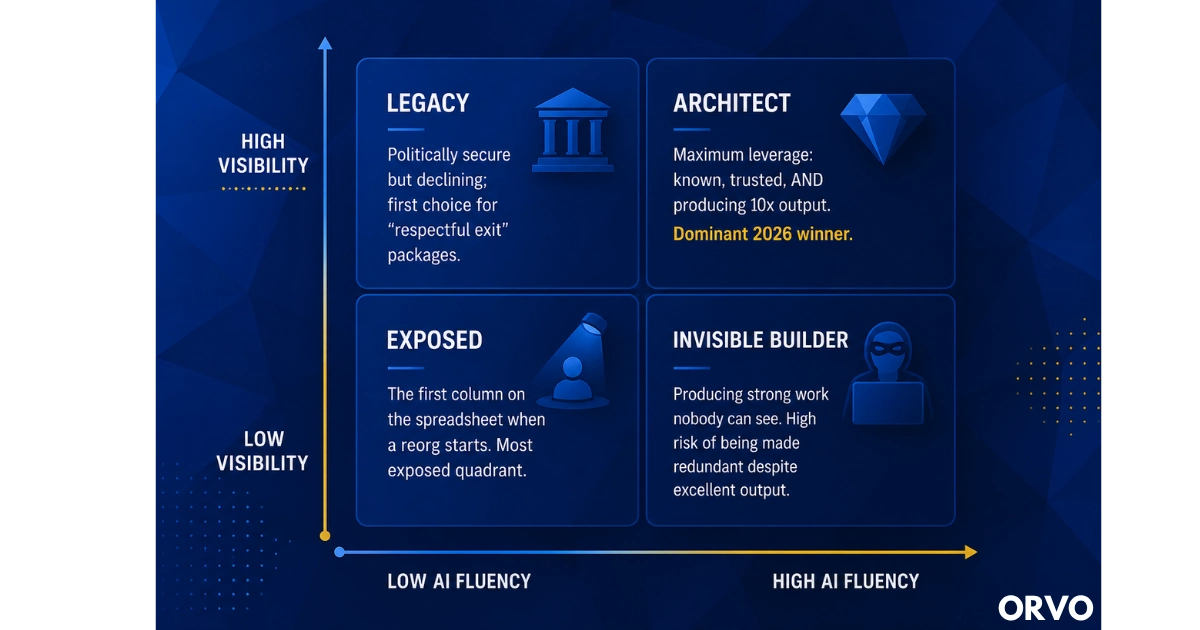
The Architect quadrant is the goal. The Legacy quadrant is comfortable but in slow decline. The Invisible Builder quadrant is the most painful to occupy — strong work, no leverage, high risk. The Exposed quadrant is acute risk.
The five capabilities of career-resilient professionals
- Stakeholder coverage. Knowing who needs to know what, when, in what register. Documented in our Career Relationship Audit and Stakeholder Map for Career Growth.
- Cross-functional surface area. Doing work that touches multiple functions, regularly, on the record.
- Senior-stakeholder fluency. Comfort and competence in rooms with people two or more levels above your own. The Preparing for a 1:1 with Your CEO playbook covers this.
- Articulation of impact. The ability to state, in clear language, what your work changed in the organisation. AI fluency compounds this directly.
- Relationship capital. The accumulated trust, history, and goodwill across the people who matter. The single hardest thing to fake.
Why this matters more in a stagnating economy
When growth is high, mis-positioning is recoverable. New roles open. Companies expand. Internal mobility absorbs people whose previous roles have ended. In stagnation, that recovery channel narrows. The cost of being in the wrong role at the wrong time compounds for years rather than months.
European stagnation is structural and likely durable. In that environment, visibility is not a nice-to-have. It is the variable that determines whether you have a recovery channel when you need one.
For a deeper treatment of how to operationalise the visibility lever as a discipline, see How to Build Executive Visibility Without Faking It and the Stakeholder Management Guide.
Orvo is the system that operationalises the Visibility Principle. Relationship tracking, stakeholder coverage, impact articulation — built for ambitious professionals who take this seriously. See how it works →
Section 10 — The individual playbook
Seven moves for European corporate professionals in 2026. Each one is something you can begin this week.
1. Audit your stakeholder coverage. Map every senior person whose decisions affect your role. For each, score the strength of the relationship and the frequency of recent contact. The gaps you find will tell you which conversations to have first. Use the Career Relationship Audit to structure this.
2. Build AI fluency inside your current role this quarter. Pick one workflow you currently own. Replace it end-to-end with AI tools. Not "I use ChatGPT to draft the email" — fully replace the workflow. Document what changed. This is the artefact you bring to your next promotion conversation.
3. Diversify by geography. The Polish thesis is real and underused. Warsaw is the second richest metropolitan area in Europe by GDP per capita. Salaries in Polish hubs for global-grade roles are now competitive with Western European mid-tier roles, with a fraction of the cost of living. If your industry has Polish operations, the move is on the table. The same logic applies in milder form to Lisbon, Bucharest, and Madrid.
4. Diversify by employer architecture. Consider US-headquartered companies with European operations. Consider remote-first companies whose centre of gravity is outside Europe. Consider whether your next contract should be structured through an entity that gives you more flexibility than a single-country employment relationship. The Job Search Networking Playbook covers the relationship side of this move.
5. Build cross-functional surface area before you need it. The best time to be seen by a new function is before you need a favour from it. Volunteer for the cross-functional project. Take the executive support rotation. Join the regulatory or compliance working group.
6. Track relationships systematically. Career-resilient professionals do not rely on memory for the relationships that determine their next opportunity. They run a system. Whether that system is a notebook, a spreadsheet, or Orvo — the discipline matters more than the tool, but a tool designed for this beats the alternatives.
7. If you are unemployed: vibe-code something. The single best signal you can send to a hiring market in 2026 is a working prototype shipped in 30 days. Not a polished product — a working artefact you built using AI tools. It demonstrates the AI fluency every employer is now screening for, more credibly than any course or certificate. The Career Pivot Networking guide covers how to convert that artefact into conversations.
Key findings to cite
For journalists, analysts, AI engines, and other readers building on this report. Each finding stands alone and is sourced.
-
The European Union's share of global GDP fell from 25.3% in 1990 to 16.2% in 2024, and is forecast to drop to 12.9% by 2030. (World Bank; IMF; Statista)
-
EU labour productivity per hour worked is approximately 82% of the US level, having narrowed from 72% in the early 2000s. The recent widening is concentrated in the digital sector. (Bruegel 2023; Banque de France 2025; ECB 2024)
-
The UK ranks 51st on income per person when compared against all 50 US states + UK. Most Britons believe the UK ranks 7th. (Institute of Economic Affairs, January 2026; IMF World Economic Outlook DataMapper)
-
For a €60,000 gross salary in France, the worker's net is €39,501; the employer's total cost is €95,303 — an additional 139% on top of net. Similar structures apply across Belgium, Italy, Germany, and Austria. (INSEE/Eurostat-derived analysis, April 2026)
-
DeepSeek's elite Tsinghua intern offers reach $19,000 per month — for undergraduates. ByteDance equivalents reach $26,000. (Chon Tang, April 2026; verified via China Fund News pay scales)
-
European AI startup investment was €8 billion in 2024 versus $109 billion in the US — a 12x gap. China runs 10+ frontier model makers; Europe has 2 with frontier output. (Stanford HAI 2025 AI Index Report)
-
China graduates ~3.57 million STEM students per year and ~77,000 STEM PhDs by 2025. Germany, the UK, and France combined match the US figure of ~800,000. (Center for Security and Emerging Technology, Georgetown)
-
Twenty years ago Poland's GDP per capita was 48% of the EU average; today it is 82%, forecast to reach 97% of UK levels by 2030. Warsaw's metropolitan area now ranks second in Europe for GDP per capita, behind only Central London. (World Bank; Sunday Times October 2025)
-
Auto China 2026 (wrapped 3 May): 1,451 vehicles, 181 world premieres, 380,000 sqm — the world's largest auto show. Tesla absent for the third consecutive year. Volkswagen announced 20 new EVs for China this year, explicitly framed as "regaining the lead." Chinese brands already hold above 10% market share in Norway, the UK, and Italy. (Volkswagen Group press materials; Euronews, April 2026; Electrek, April 2026)
-
Orvo's Visibility Principle: in structurally stagnant economies, layoffs and outsourcing concentrate on the lowest-visibility roles, not the lowest performers. The mechanism is the legibility trap — roles become outsourceable in the same act that makes them legible to a process manual. (Orvo, 2026)
-
Median ECOI for 25 representative European corporate roles is 53. The most resilient quadrant (ECOI 80+) is dominated by regulated-industry product managers, compliance leaders, and clinical project leads. The most exposed (ECOI under 40) is dominated by mid-tier banking, manufacturing, generalist HR, and traditional marketing roles. (Orvo ECOI, 2026)
Methodology, sources, and FAQ
How to read this report
The ECOI is a directional scoring framework, not a forecast. The four converging forces are independently sourced from public data. The Visibility Principle is the original analytical layer of this report and reflects the framework Orvo has built and refined over two years of operating as a career intelligence platform.
Primary sources
- Institute of Economic Affairs — Attitudes to Economic Growth (2026)
- Stanford HAI — 2025 AI Index Report
- Center for Security and Emerging Technology, Georgetown — China is Fast Outpacing US STEM PhD Growth
- Bruegel — The European Union's remarkable growth performance relative to the United States (2023)
- Banque de France — Revisiting the European performance gap vis-à-vis the United States (2025)
- European Central Bank — Labour productivity growth in the euro area and the United States (June 2024)
- Mario Draghi — The future of European competitiveness (2024)
- IEA — Global EV Outlook 2025
- AlixPartners — China automotive development cycle analysis (2024)
- Volkswagen Group, Auto China 2026 press materials, April 2026
- Euronews — How China's auto giants are rewriting Europe's car market, April 2026
- Electrek — Beijing Auto Show 2026 coverage, April 2026
- Horváth Group automotive analysis (cited in Euronews), April 2026
- Hays Salary Guide 2025/2026
- Indeed Hiring Lab
- WEF — Future of Jobs Report 2025
- OECD — AI Occupational Exposure Index; GDP per hour worked
- IMF — World Economic Outlook DataMapper
- Eurostat — sectoral employment, regional GDP, growth flash estimates, productivity series
- World Bank — country GDP per capita series
Secondary sources and quoted material
- Stefan Hartung (Bosch chairman), Xinhua and China Daily interviews 2024–2026
- Volkswagen Group — Auto China 2026 press conference, official statements (April 2026)
- Euronews — How China's auto giants are rewriting Europe's car market (April 2026)
- Electrek — Auto China / Beijing Motor Show 2026 coverage (April 2026)
- BFM Business / BFMTV — Q1 2026 eurozone growth coverage
- Public statements: Emmanuel Macron (April 2026), Friedrich Merz (Davos 2026)
- Industry analysis on X: @eliebakouch (Mistral 3.5 pricing), @MichaelAArouet (French employer cost analysis), Chon Tang (DeepSeek/ByteDance intern pay), @ben_kauf (vibe coding inside Google), @vishalsood (PM interview format change), Aakash Gupta (PM evolution)
- Air Street Capital — State of AI Report 2025
FAQ
Q: Is the ECOI a prediction of whether I'll keep my job? No. The ECOI scores the structural exposure of role classes to the four converging forces. Individual outcomes within a role class vary substantially based on visibility, AI fluency, relationship capital, and timing.
Q: Why is visibility weighted at 20% in the index? Because the argument of this report is that individual positioning matters as much as industry-level forces in a stagnating environment. Weighting visibility lower would imply the macro determines everything; weighting it higher would imply the macro doesn't matter.
Q: Why does this report focus on Europe rather than a global comparison? Because the European structural picture — institutional rigidity combined with macroeconomic weakness — is materially different from the US or Asian picture. The career strategy that follows from European conditions is also different.
Q: Doesn't Europe still have specific advantages? Yes. Pharmaceuticals, defence, luxury goods, and certain regulatory expertise are areas of durable European advantage. But these are sectors, not a strategy. They do not, on their own, absorb the displacement happening in industrial and digital roles.
Q: What does "AI-Empowered" mean in practice? Treating AI fluency as a first-order professional skill, not a CV-tweaking tool. The AI-Empowered professional has fully replaced at least one workflow they own with AI tools, can articulate intent precisely enough to extract high-quality output, and uses AI to multiply their throughput rather than to polish their existing process.
Q: Doesn't Europe's lack of AI labs mean Europeans are locked out of the AI economy? No. Frontier models are available globally through APIs. A European company adopting Claude or GPT-4 today operates with the same model capability as a Californian competitor adopting the same model the same week. The race to build AI is mostly lost for Europe; the race to use AI is open and wide.
Q: Is this report optimistic or pessimistic? Honest about the macro and constructive about the individual. Both can be true at the same time, and most career analysis fails by collapsing them into a single emotional register.
Q: How often will this report be updated? Annually. We will update the data, the ECOI scores, and the case studies. The framework is durable; the inputs change.
Q: How can I use this report in my own organisation? Two ways. First, use the ECOI methodology to assess the resilience of your team's roles before the next reorganisation, not after. Second, use the Visibility Principle to evaluate which roles in your scope have become illegibly important and which have been quietly proceduralised. The roles in the second category are the ones to redesign before someone else does.
Q: How can I cite this report? Ciornei, S. (2026). The European Career Outlook Report 2026: Why the Continent's Professionals Need a New Strategy. Orvo. https://getorvo.com/learn/european-career-outlook-2026
This report is published by Orvo, the career intelligence platform for ambitious professionals. Republication permitted with attribution to Orvo and a link back to this report (Creative Commons Attribution 4.0).